Availability in System Design: A Complete Guide
Introduction – Why Availability in System Design Matters
Imagine your favourite shopping site goes down during a big sale or a multiplayer game server crashes mid-match. Those outages cost money, trust, and time. Availability is the engineering discipline that reduces those risks.
In this article you’ll learn:
- What availability is and how to measure it.
- How small changes in “nines” drastically affect downtime.
- Practical design techniques to improve availability.
- How planned and unplanned downtime differ — and how to reduce both.
Availability in System Design: Availability is one of the most crucial factors in system design, alongside reliability and scaling. It refers to the probability that a system is operational and accessible when users need it.
The higher the availability, the more reliable the system appears to end users.
Availability Formula
Availability is generally calculated using the formula:

- Uptime: Time when the system performs as expected.
- Downtime: Time when the system is unavailable (due to maintenance, failures, etc.).
Example
If a system is down for 1 hour in a 30-day month:
- Hours in month = 30 × 24 = 720
- Uptime = 720 − 1 = 719
- Availability = (719 / 720) × 100 = 99.86%
Levels of Availability (“Nines”)
Small improvements in decimals significantly impact downtime.
| Availability | Downtime per Year | Common Term |
|---|---|---|
| 99% | ~3.65 days | Two nines |
| 99.9% | ~8.76 hours | Three nines |
| 99.99% | ~52 minutes | Four nines |
| 99.999% | ~5 minutes | Five nines |
Most critical systems (like banking, healthcare, stock trading) aim for four nines or higher.
Tip: Don’t pick a “five nines” target unless you need it — higher availability costs more and adds complexity. Google’s Site Reliability Engineering book has a good breakdown of how to reason about acceptable risk when choosing a target.
SLA, SLO and SLI: How Availability Is Promised and Measured
In real teams, availability is not a vague goal; it is written down and measured. Three terms come up constantly, both in production and in interviews:
- SLI (Service Level Indicator) – the actual measurement, for example “the percentage of HTTP requests that returned a non-5xx response within 500 ms”.
- SLO (Service Level Objective) – the internal target for that indicator, for example “99.9% of requests succeed over a rolling 30 days”.
- SLA (Service Level Agreement) – the external, often contractual promise to customers, usually a little looser than the SLO and backed by penalties such as service credits.
The gap between 100% and your SLO is your error budget. A 99.9% monthly SLO allows about 43 minutes of failure in a 30-day month. While budget remains, the team can ship features and take reasonable risks; once it is spent, the focus shifts to stability work. This turns the abstract question “how available should we be?” into a concrete engineering trade-off.
How Availability Combines Across Components
A real request rarely touches just one component. It passes through a load balancer, an application server and a database, and each has its own availability. How they are connected changes the overall number dramatically.
Components in series: availability multiplies down
If a request needs every component to work, the overall availability is the product of each one:
A(total) = A1 × A2 × A3 ...Take a load balancer at 99.99%, a single app server at 99.9% and a single database at 99.95%. The chain is 0.9999 × 0.999 × 0.9995 ≈ 99.84%, or roughly 14 hours of downtime a year. The system is always less available than its weakest link.
Components in parallel: redundancy multiplies up
If a request needs only one of several redundant copies to work, the system fails only when all of them fail at once:
A(total) = 1 − (1 − A1) × (1 − A2) ...Two independent app servers at 99.9% each give 1 − (0.001 × 0.001) = 99.9999% for that tier. Replace the single app server in the chain above with this redundant pair, and give the database a replica with automatic failover (say 99.99%), and the whole path rises to about 99.98%, under two hours of downtime a year. That arithmetic is the core reason redundancy is the first tool for high availability.
Caveat: the formula assumes failures are independent. Two servers in the same rack, on the same power supply or running the same buggy release can fail together, which is why real designs spread replicas across availability zones and roll out changes gradually.
Key Strategies to Achieve High Availability in System Design
Below are practical, easy-to-understand techniques used in production systems.
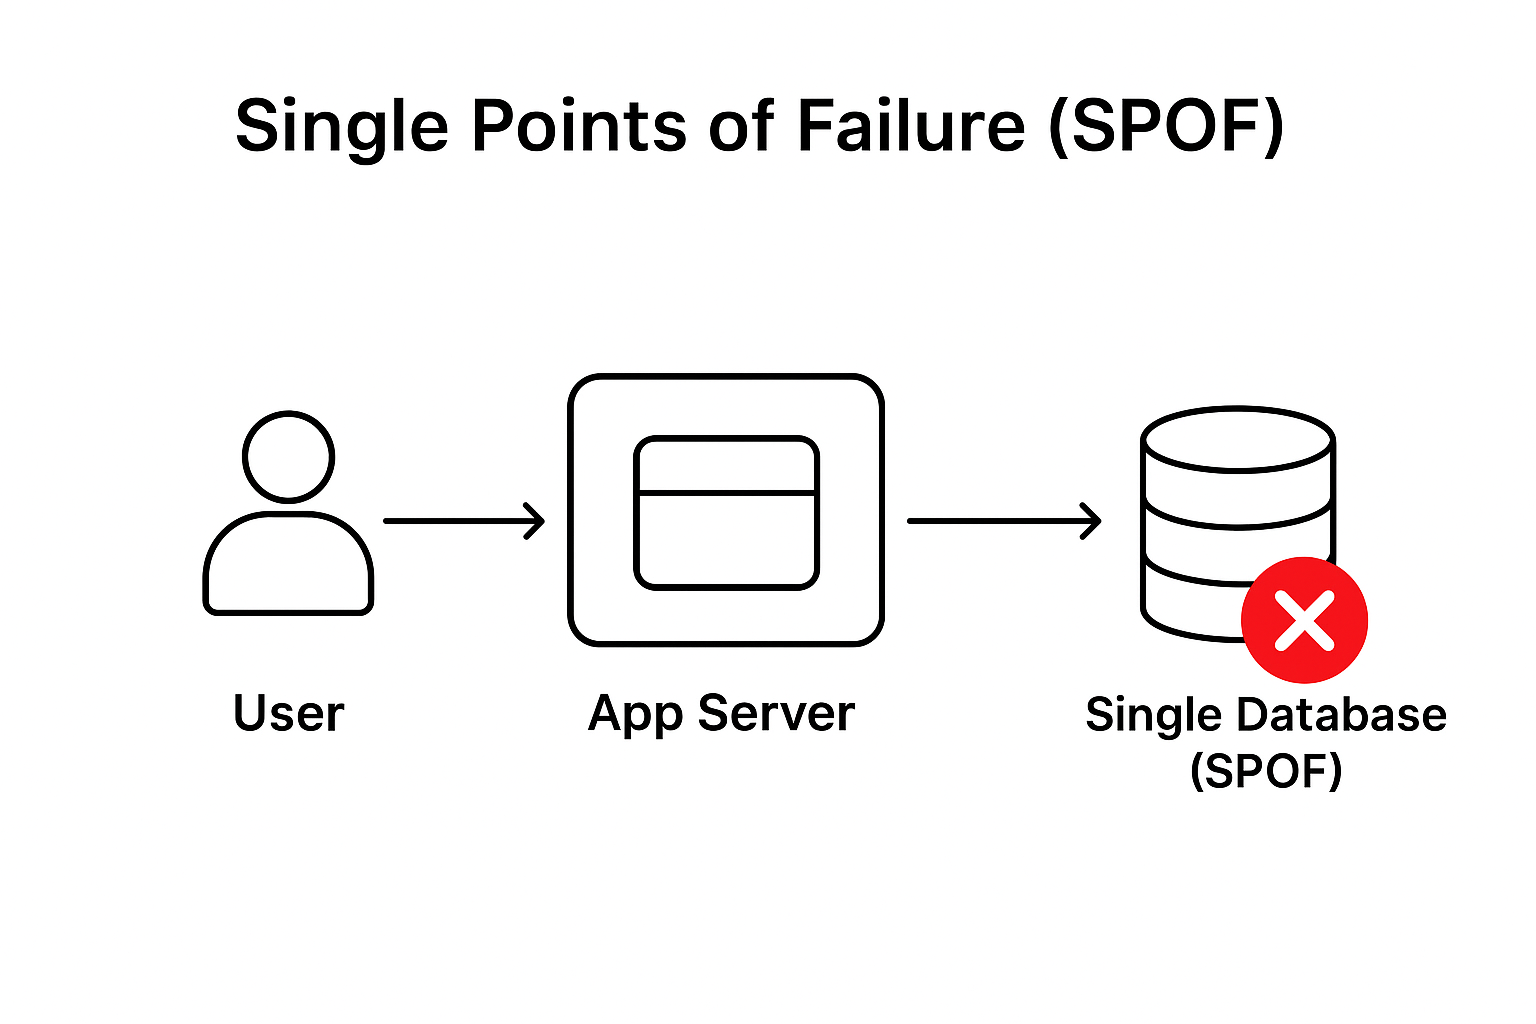
1. Eliminate Single Points of Failure (SPOF)
- Replace single servers with multiple servers.
- Add redundancy at every layer (frontend, app, database, network).
Mini example: If your only database instance fails, all users are impacted. A primary + replica setup avoids that.
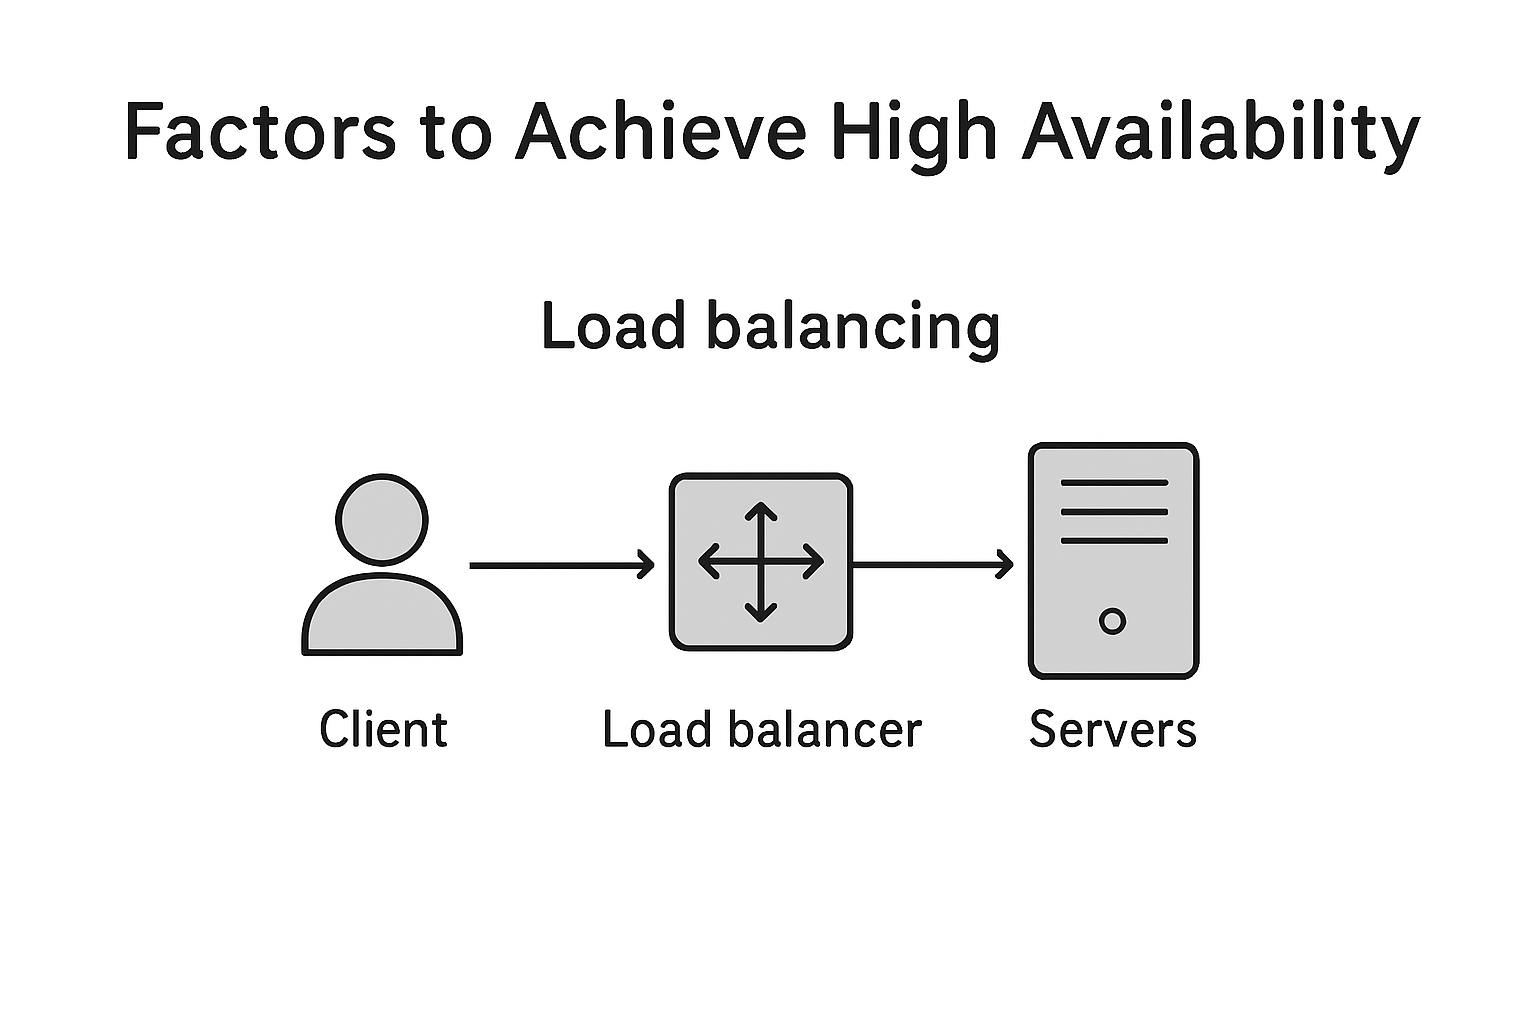
2. Load Balancing
- Distributes incoming traffic across multiple servers to avoid overload and hide node failures.
- Common options: AWS ELB, GCP Load Balancer, NGINX.
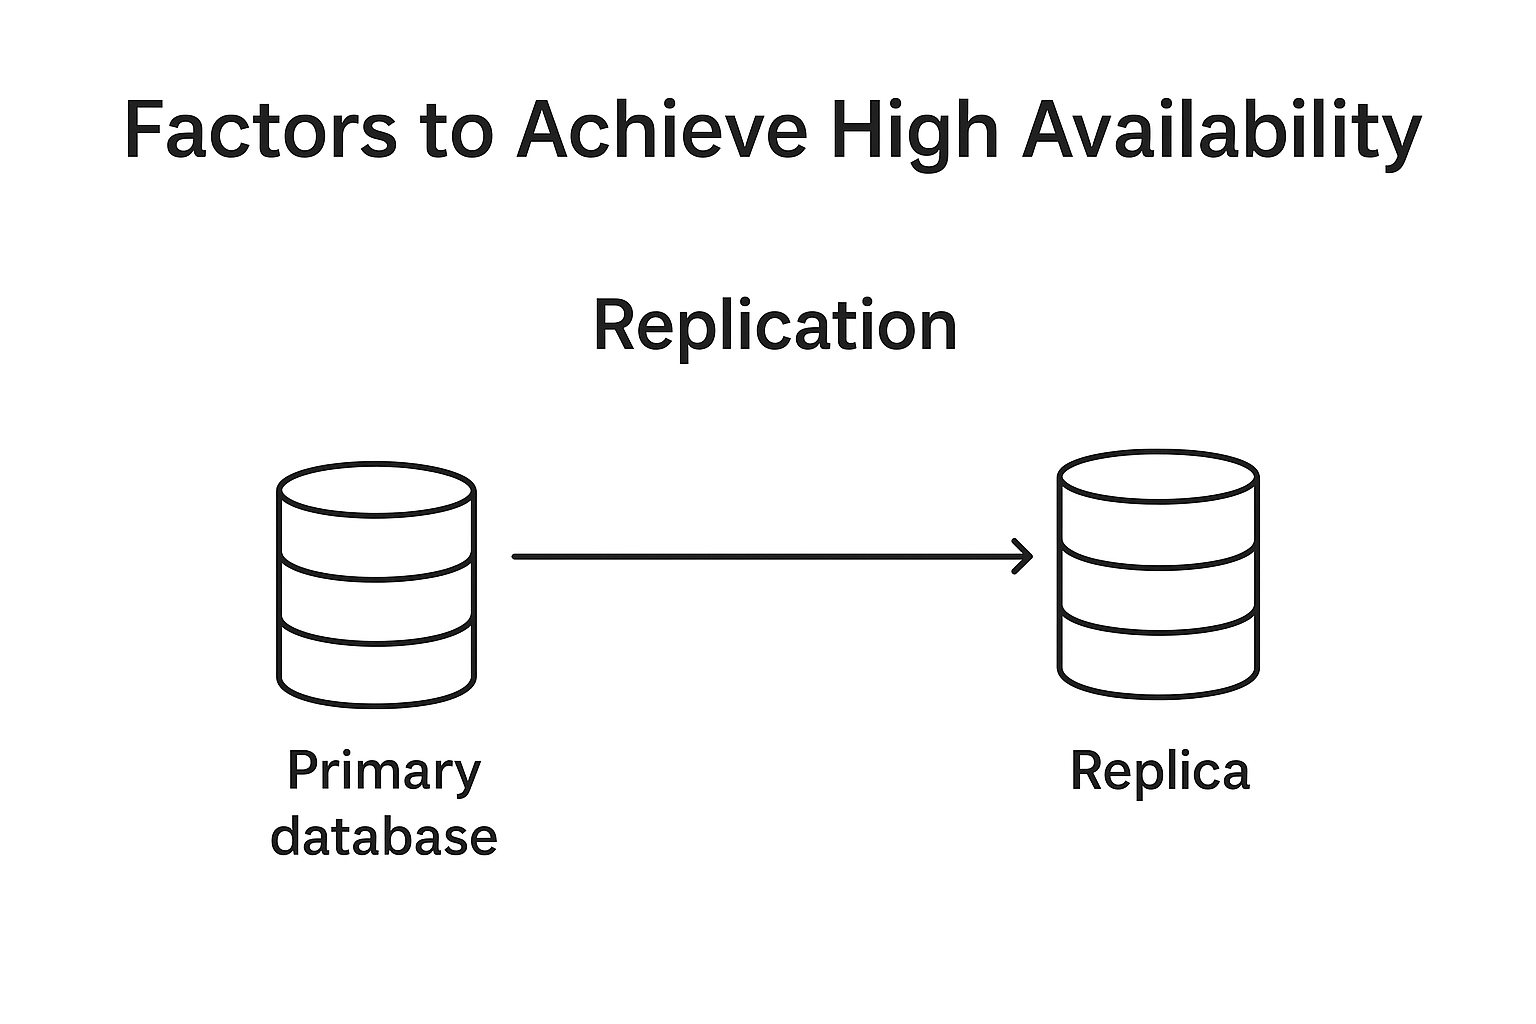
3. Replication
- Keep multiple copies of data across nodes so a replica can serve when primary fails.
- Typical modes: master-slave (primary + read replicas) and master-master (bi-directional).
Caution: Multi-master simplifies availability but adds conflict resolution complexity.
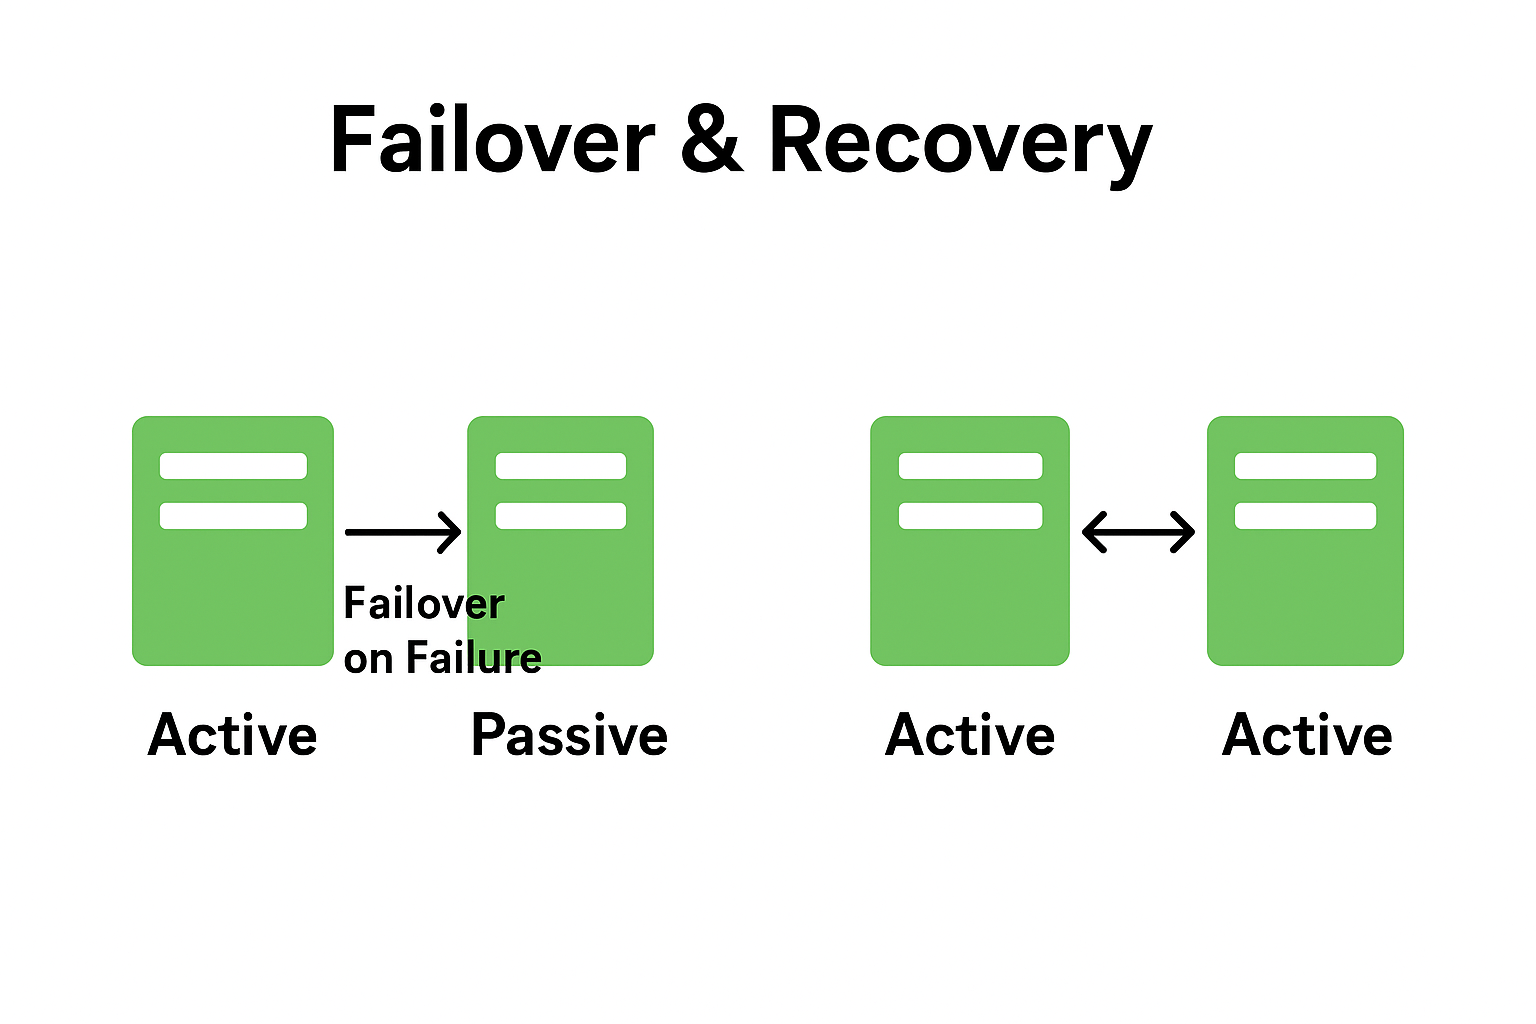
4. Failover & Recovery
- Automatically switch to backup systems when the primary fails.
Types:
- Active-Passive: One active instance, backups hot/standby.
- Active-Active: All instances serve traffic and share load.
Note: Active-active reduces downtime but requires careful data consistency management.
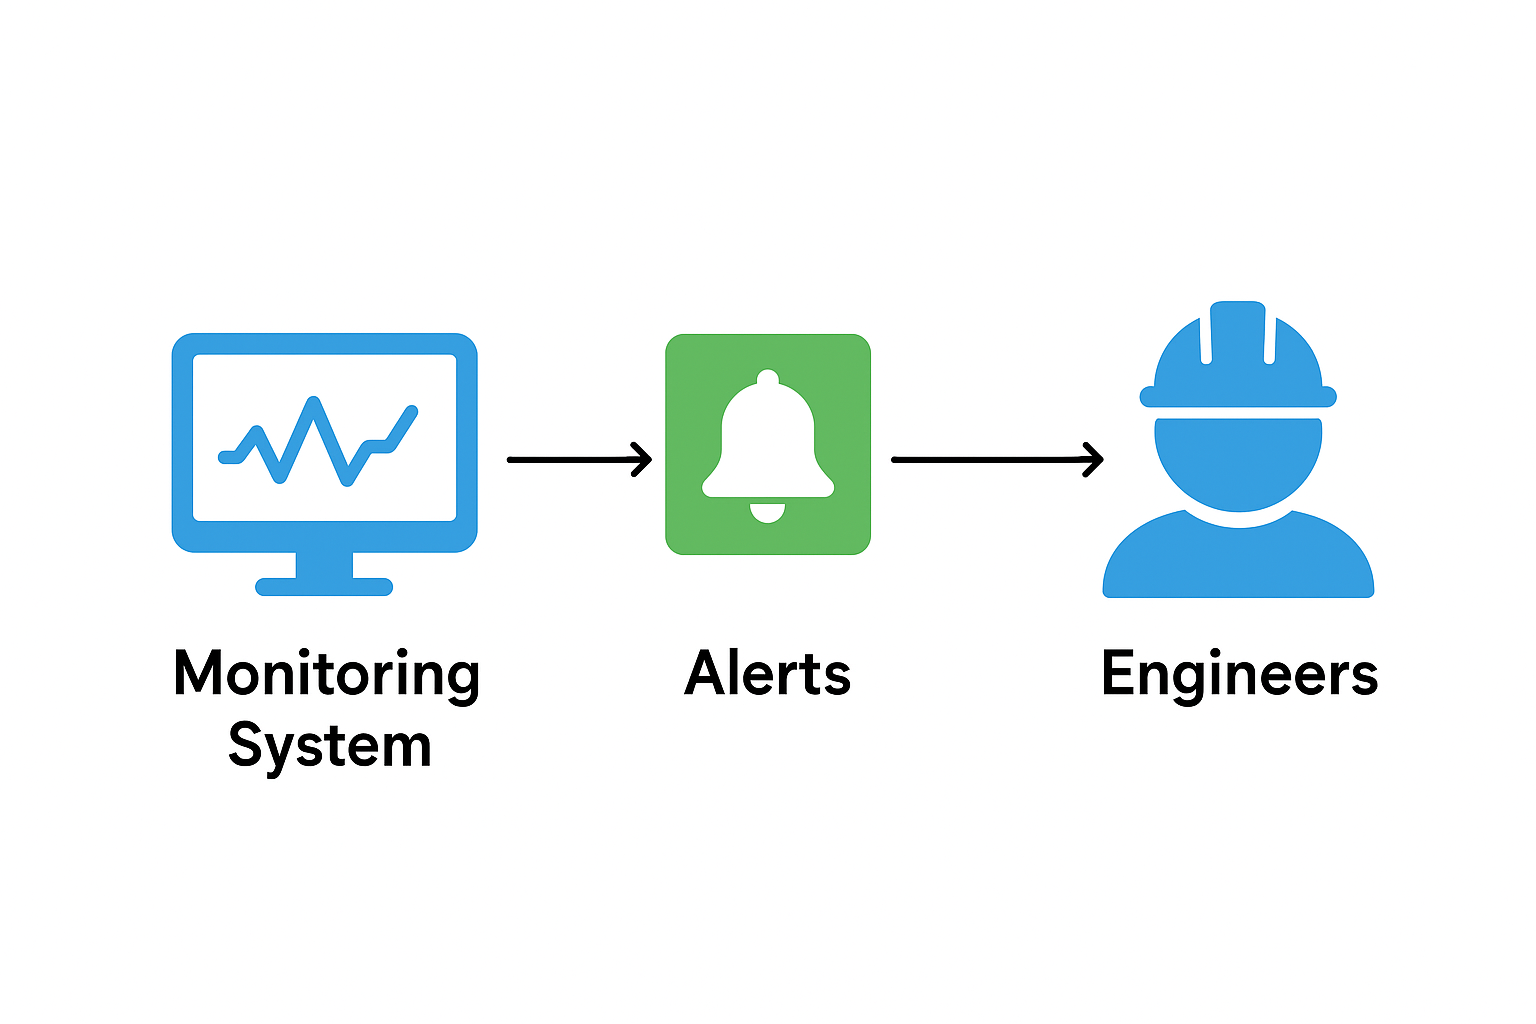
5. Monitoring & Alerting (crucial)
- Observe system health: CPU, memory, latency, error rates, and business metrics.
- Good monitoring reduces MTTD (Mean Time To Detect) and MTTR (Mean Time To Repair).
Examples: Datadog, Grafana, Prometheus, CloudWatch, ELK stack.
Benefits:
- Early detection of issues.
- Root cause analysis via logs.
- Prevents future failures.
Tip: Set intelligent alerts (thresholds + anomaly detection) to avoid alert fatigue.
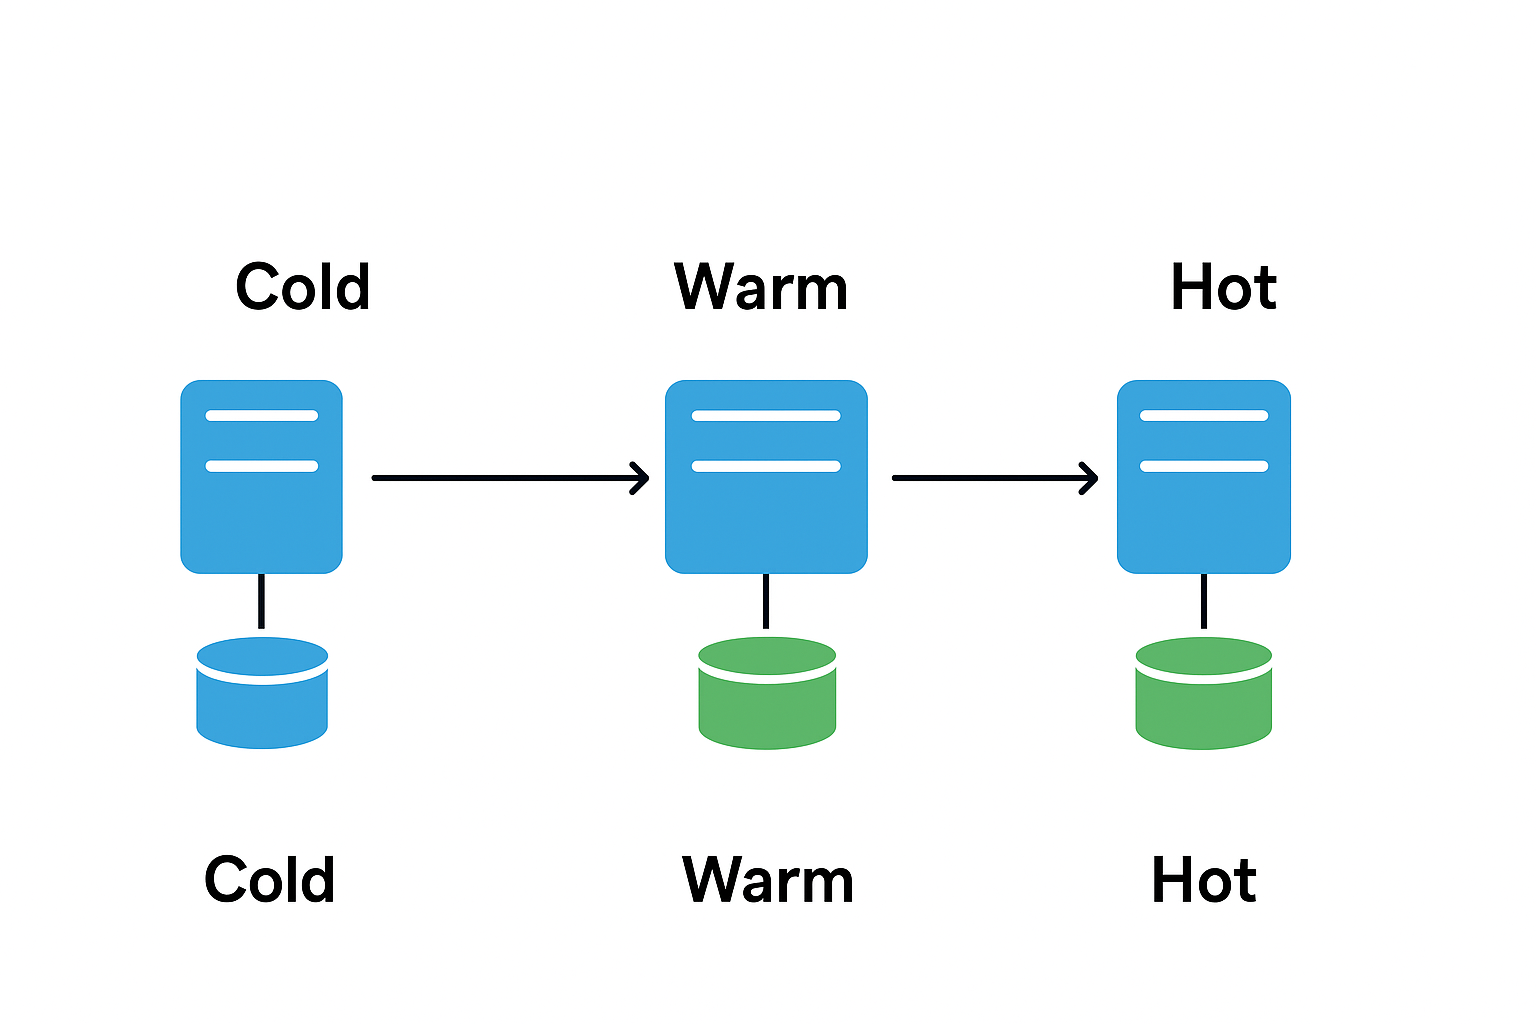
6. Disaster Recovery (DR)
- Prepare for major incidents — hardware failures, data centre loss, natural disasters.
DR approaches:
- Cold standby: Backups stored offsite; manual restore when needed (cheapest, slowest).
- Warm standby: Partial systems running in another region; scale up when needed.
- Hot standby: Fully mirrored system in another region for near-instant failover (fastest, costliest).
7. Graceful Degradation
Not every feature is equally important. When a non-critical dependency fails, the system should keep its core journey working instead of failing completely. An e-commerce site whose recommendation service is down should still let people search, add to cart and pay, simply hiding the “You may also like” section.
- Classify features as critical (login, checkout, payments) and non-critical (recommendations, reviews, analytics).
- Return cached or default responses when a non-critical service times out.
- Use feature flags to switch off expensive features during an incident.
8. Health Checks, Timeouts and Circuit Breakers
Redundancy only helps if traffic is steered away from broken instances quickly. Load balancers and orchestrators such as Kubernetes rely on health checks (liveness and readiness probes) to stop sending requests to unhealthy instances.
Inside the application, every remote call should have a timeout, and calls to fragile dependencies should go through a circuit breaker (for example Resilience4j in Spring Boot). When a dependency keeps failing, the breaker “opens” and fails fast instead of letting threads pile up, which prevents one slow service from taking down everything that calls it.
9. Multi-Zone and Multi-Region Deployment
Cloud providers group data centres into availability zones within a region. Running instances and database replicas across at least two or three zones protects against the loss of a single data centre with little extra latency. Multi-region deployment goes further and survives the loss of an entire region, but it adds real complexity around data replication, consistency and traffic routing, so it is usually reserved for systems with the strictest availability targets.
RTO and RPO: Choosing the Right Recovery Strategy
Two numbers decide which disaster recovery approach a system needs:
- RTO (Recovery Time Objective) – how long the system may be down after a disaster before the business impact becomes unacceptable.
- RPO (Recovery Point Objective) – how much data, measured in time, the business can afford to lose.
| Requirement | Typical RTO / RPO | Suitable approach |
|---|---|---|
| Internal tool or reporting system | Hours / up to a day | Cold standby with regular backups |
| Customer-facing product | Minutes to an hour / minutes | Warm standby in another zone or region |
| Payments, trading, healthcare | Seconds to minutes / near zero | Hot standby or active-active with synchronous replication |
A lower RTO and RPO always cost more. Asking the business for these two numbers early is one of the most useful things you can do when designing for availability.
Planned vs Unplanned Downtime
Planned Downtime
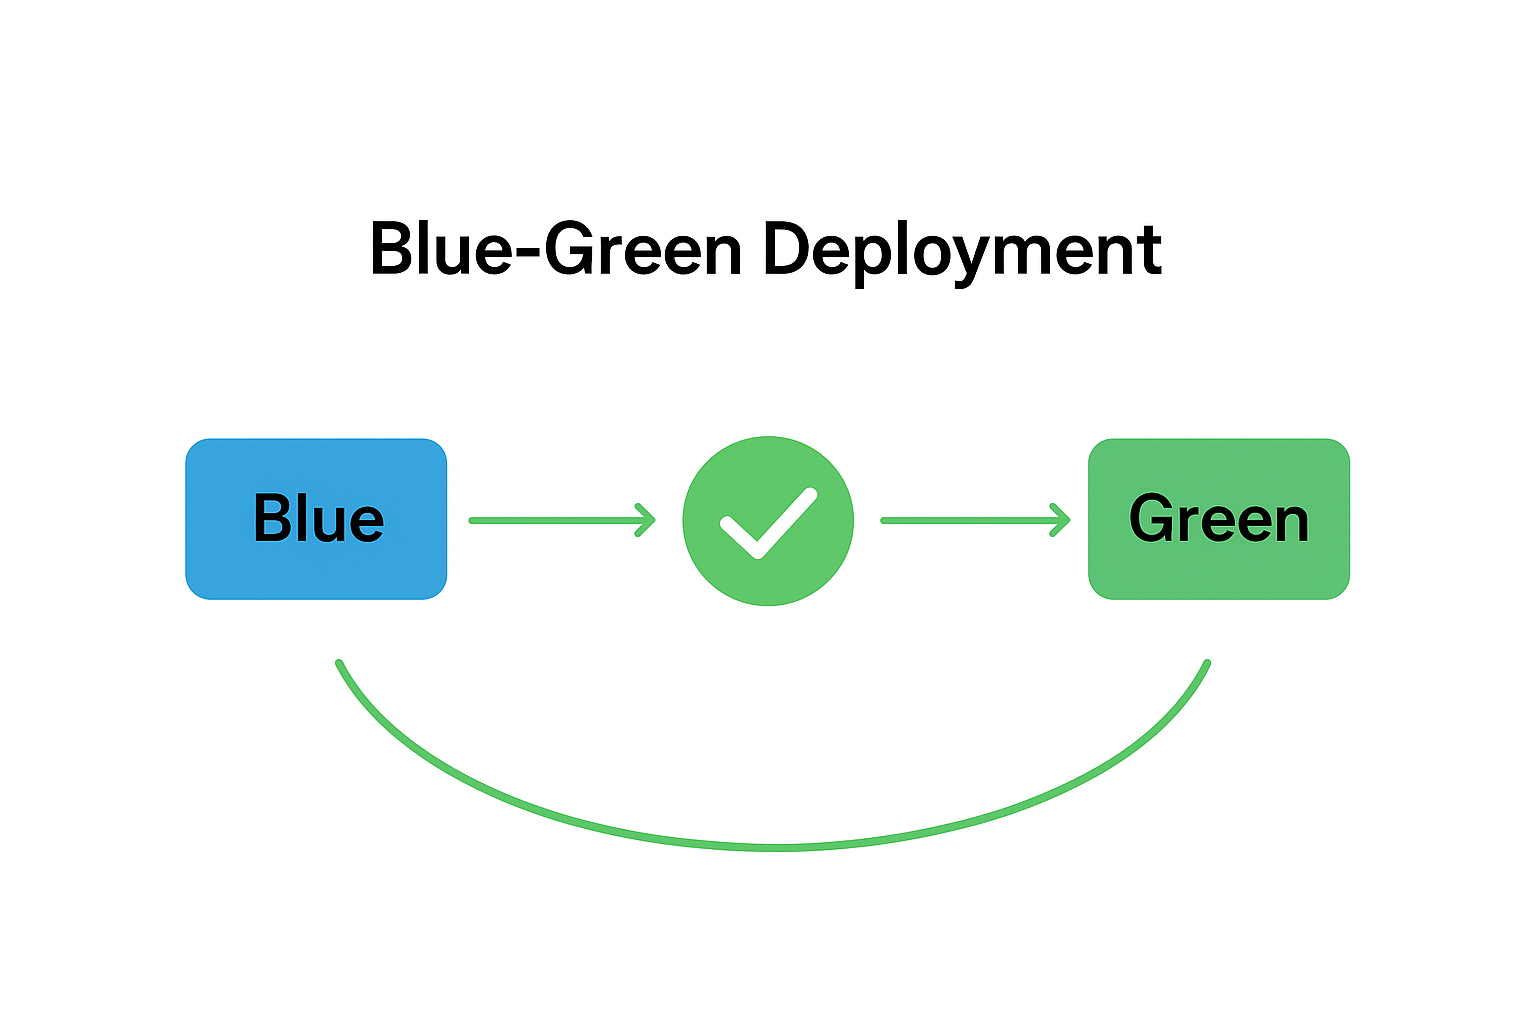
- Scheduled activities: upgrades, schema changes, backups.
- Usually scheduled during off-peak hours to reduce impact.
- Mitigations: rolling updates, blue/green deployments, canary releases.
Unplanned Downtime
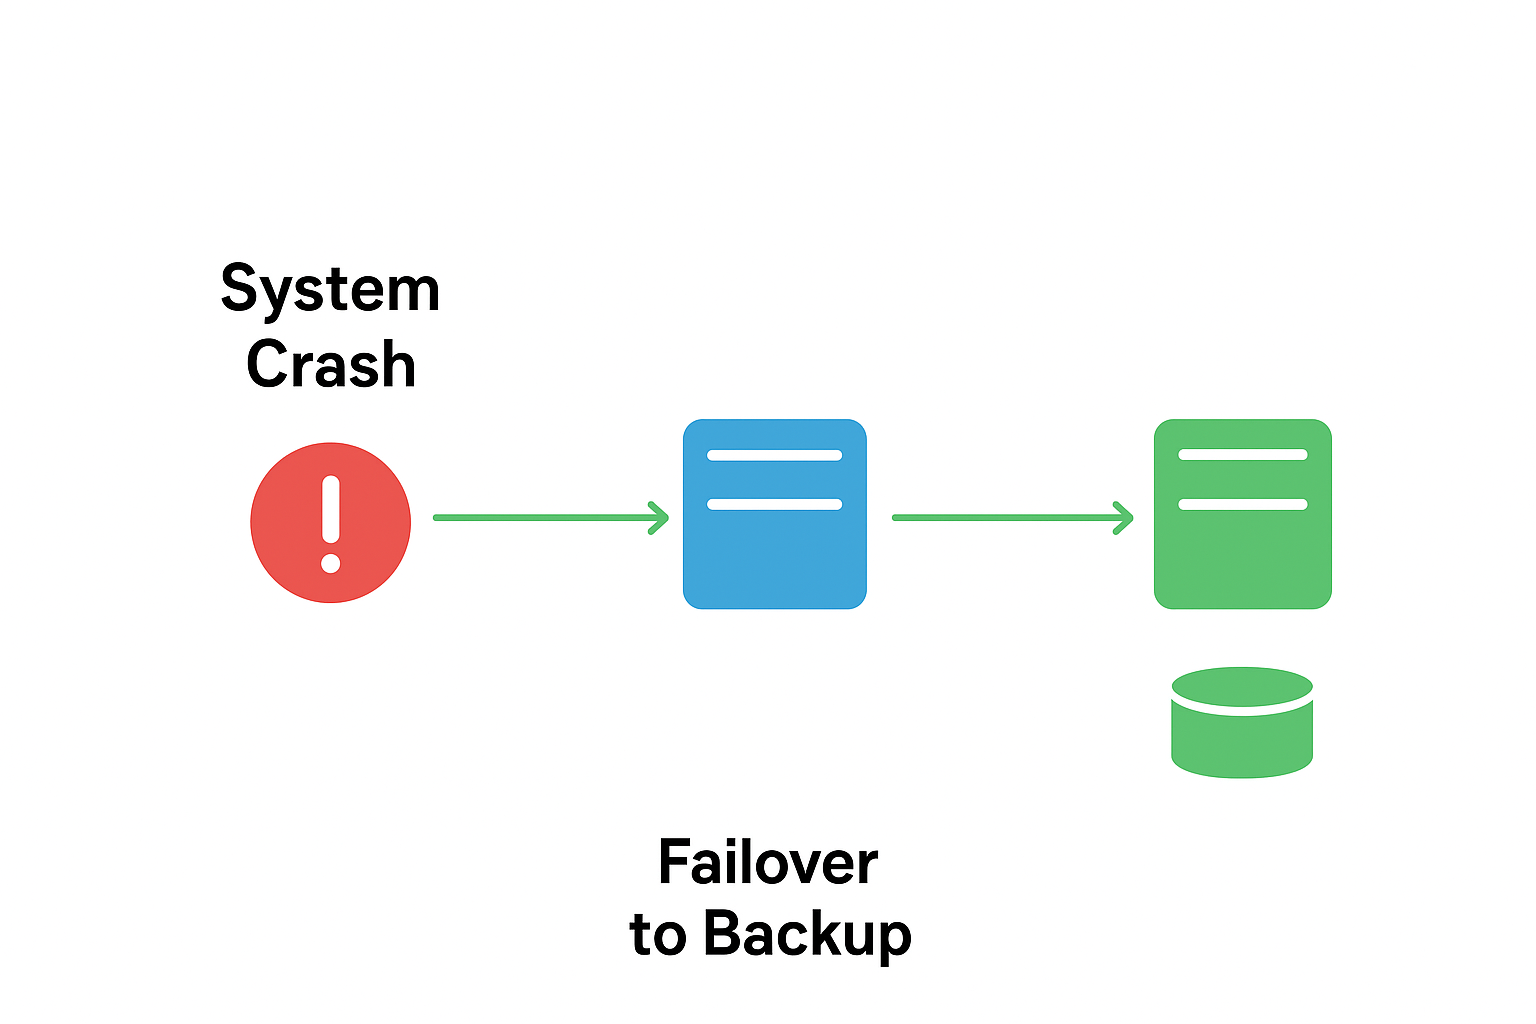
- Unexpected outages: hardware failure, software bugs, network issues, security incidents.
- Higher impact on user trust and revenue.
- Mitigations: redundancy, failover automation, quick recovery procedures, monitoring.
Putting It All Together — a short checklist
When designing for availability, use this checklist:
- Remove single points of failure across all layers.
- Put a load balancer in front of stateless app servers.
- Replicate data and ensure fast failover paths.
- Implement monitoring, alerts, and runbooks.
- Plan DR strategy (cold/warm/hot) based on RTO/RPO requirements.
- Automate deployments to minimize planned downtime.
Availability vs Reliability
The two terms are often used interchangeably, but they measure different things. Availability asks “is the system up and responding right now?” Reliability asks “does it keep working correctly over time without failing?” A service that crashes for one second every few minutes can still show high availability on a dashboard, yet it is clearly unreliable for users in the middle of a payment. Good designs track both; our guide to reliability in system design covers MTBF, MTTR and the other reliability metrics in detail.
Worked Example: Making an E-Commerce Checkout Highly Available
Suppose you are asked to design the checkout flow of a large online store with a 99.95% availability target. A step-by-step approach looks like this:
- Edge – serve static assets from a CDN and put a managed load balancer, which is itself redundant, in front of the application.
- Application tier – run stateless checkout services in at least three instances across multiple availability zones, with health checks and auto-scaling.
- Data tier – use a primary database with a synchronous standby in another zone and automatic failover; serve read-heavy data such as product details from a cache.
- Dependencies – wrap payment gateway and inventory calls with timeouts, retries with backoff and circuit breakers; queue order-confirmation emails so a mail outage never blocks checkout.
- Degradation – if recommendations or reviews fail, hide them; never let them block the purchase.
- Operations – deploy with canary or blue-green releases, alert on checkout success rate rather than just CPU, and keep a tested runbook for database failover.
Each step removes a single point of failure or limits the blast radius of one, which is exactly the reasoning an interviewer wants to hear.
Interview Tips: Talking About Availability
- Ask for the target up front: “What availability does the business need: three nines or four?” It shapes every later decision.
- Do the series/parallel arithmetic out loud for the main request path; it shows you understand why redundancy matters.
- Name the single points of failure in your own design and say how you would remove each one.
- Mention the consistency trade-off: higher availability across regions usually means accepting eventual consistency somewhere (the CAP theorem).
- Do not forget operations: monitoring, alerting, deployments and runbooks matter as much as architecture.
Frequently Asked Questions
What does 99.99% availability mean in practice?
Four nines allows about 52 minutes of downtime per year, or roughly 4.3 minutes per month. Achieving it usually requires redundancy at every layer, automatic failover and very disciplined deployments.
Is 100% availability possible?
No. Hardware fails, networks partition, software has bugs and humans make mistakes. The goal is to choose a target the business genuinely needs and design so that failures are rare, short and contained.
Does planned maintenance count against availability?
It depends on how the SLA is written. Many SLAs exclude announced maintenance windows, but users still experience them as downtime, which is why modern systems use rolling and blue-green deployments to avoid maintenance windows altogether.
How is availability different from fault tolerance?
Fault tolerance is the ability to keep operating when a component fails. It is one of the main techniques used to achieve high availability, alongside fast detection, fast recovery and good operational practices.
Conclusion
Availability is a balance between cost, complexity, and business needs. Start by eliminating easy single points of failure, add monitoring, and iterate — measure the impact and raise your SLA target only when necessary.
High availability is not about eliminating downtime completely—that’s impossible. Instead, it’s about:
- Reducing both planned and unplanned downtime.
- Ensuring redundancy, failover, and monitoring.
- Designing systems that recover gracefully when failures happen.
The end goal: Users should barely notice failures.